Introduction
HAT-P-16 b is positioned at (J2000) R.A. = 00h38m17s.59, De. = + 42°27'47".2, in Andromeda, the host of which has 10.8 Vmag. According to the Exoplanet Transit Database (ETD), the transit leads to a decrease in brightness of its star seen from the earth is 0.0101 mag, and the duration is around 184-min.
The equipment used to monitor the event was 14" SCT f/6.9 + clear QHY9 CCD.
Overall 543 images were remotely taken by Xing Gao, from Urumqi, China at predawn on Sep 06 local time, which were later callibrated with bias, dark, and flat frames in MaxIm DL V 5.09 by me. Subsequently I sort these images into quituplets and the left three images were ignored, all of which were stacked in Astrometrica by means of median. The outcome images were fed into MPO Canopus to measure the brightness variation.
All of the images were slightly out of focus. In terms of astrophotography, it was disastrous. However, in terms of photometry, it turned out to render me higher precision. But I have not yet understood what the reason(s) should be. Better eliminating atmospheric scintillation and optical defect of the instrument?
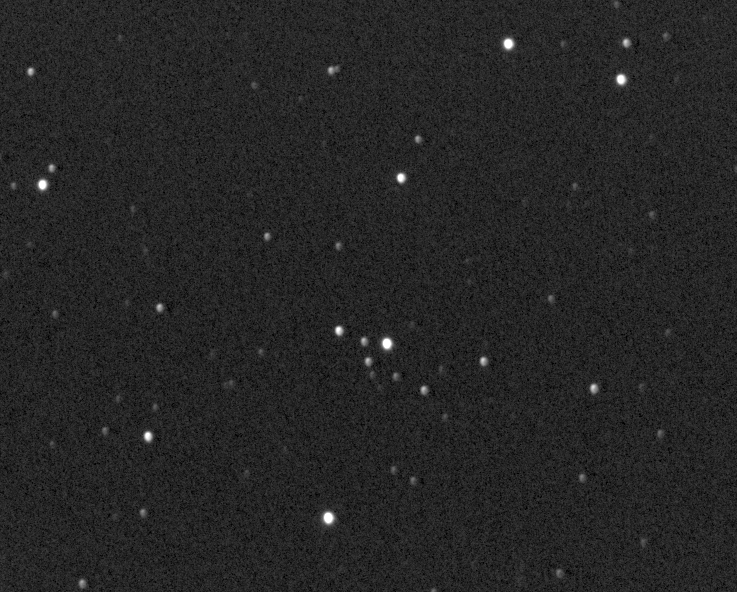
The target along with five comparison stars used for photometry. Mouseover to see labels:

Here comes the data:
TARGET: HAT-P-16 b
DATE/TIME: 2011 Sep 05 @ 20:54
FILTER: C
TELESCOPE: SCT 0.36m f/6.9
FOCAL LENGTH: 97.40
CAMERA: QHY9 CCD
TEMP (C): -26
EXPOSURE (s): 15
EXPOSURE JD: Mid-exposure
JD CORR METHOD: Light-time
JD CORRECTION: JD = JD(raw) - 0.00000d
UNITY CORR: -5 * log(SunDist * EarthDist): N/A (Sun and/or Earth distance not computed)
NOTE: The unity correction is NOT included in the reduced magnitudes.
MAG. METHOD: Instrumental
BASE COMP VALUE: -11.486
BASE CORRECTION: +0.000
PHASE/DIST CORR: +0.000
P/D ADJUST (-/DAY):+0.000
P/D ADJUST (+/DAY):+0.000
THE P/D ADJUSTMENTS ARE NOT INCLUDED IN THE VALUES BELOW.
ERROR CALC: The magnitude error is calculated by the following:
Err = sqrt(sqr(ERR[target]) + sqr(Err[Comps]))
where Err[Target] = 1.0857/SNR[target]
Err[Comps] = sqrt(sqr(1.0857/SNR[Comp1])... + sqr(1.0857/SNR[CompN])) / N
The factor of 1.0857 converts flux to magnitudes (Howell)
*********************************************************************************************-------------------------------- J.D. Obj-CAvg Err -------------------------------- 2455810.33099 -0.620 0.001 2455810.33171 -0.635 0.001 2455810.33242 -0.635 0.001 2455810.33314 -0.635 0.001 2455810.33386 -0.634 0.001 2455810.33460 -0.635 0.001 2455810.33531 -0.633 0.001 2455810.33602 -0.635 0.001 2455810.33675 -0.626 0.001 2455810.33748 -0.631 0.001 2455810.33824 -0.622 0.001 2455810.33895 -0.620 0.001 2455810.33969 -0.633 0.001 2455810.34042 -0.623 0.001 2455810.34116 -0.626 0.001 2455810.34189 -0.631 0.001 2455810.34263 -0.630 0.001 2455810.34336 -0.627 0.001 2455810.34409 -0.643 0.001 2455810.34486 -0.633 0.001 2455810.34557 -0.629 0.001 2455810.34631 -0.622 0.001 2455810.34704 -0.627 0.001 2455810.34778 -0.634 0.001 2455810.34850 -0.635 0.001 2455810.34925 -0.626 0.001 2455810.34999 -0.630 0.001 2455810.35072 -0.629 0.001 2455810.35148 -0.628 0.001 2455810.35224 -0.624 0.001 2455810.35297 -0.632 0.001 2455810.35372 -0.625 0.001 2455810.35446 -0.633 0.001 2455810.35526 -0.620 0.001 2455810.35600 -0.617 0.001 2455810.35674 -0.618 0.001 2455810.35749 -0.626 0.001 2455810.35822 -0.625 0.001 2455810.35899 -0.629 0.001 2455810.35972 -0.610 0.001 2455810.36047 -0.606 0.001 2455810.36120 -0.617 0.001 2455810.36195 -0.609 0.001 2455810.36269 -0.616 0.001 2455810.36345 -0.622 0.001 2455810.36421 -0.618 0.001 2455810.36496 -0.612 0.001 2455810.36575 -0.608 0.001 2455810.36650 -0.611 0.001 2455810.36725 -0.626 0.001 2455810.36799 -0.615 0.001 2455810.36874 -0.607 0.001 2455810.36951 -0.608 0.001 2455810.37026 -0.614 0.001 2455810.37101 -0.617 0.001 2455810.37176 -0.617 0.001 2455810.37253 -0.612 0.001 2455810.37329 -0.615 0.001 2455810.37405 -0.603 0.001 2455810.37480 -0.611 0.001 2455810.37556 -0.619 0.001 2455810.37630 -0.614 0.001 2455810.37707 -0.614 0.001 2455810.37782 -0.612 0.001 2455810.37858 -0.608 0.001 2455810.37932 -0.615 0.001 2455810.38010 -0.602 0.001 2455810.38084 -0.612 0.001 2455810.38160 -0.613 0.001 2455810.38237 -0.612 0.001 2455810.38313 -0.611 0.001 2455810.38391 -0.619 0.001 2455810.38467 -0.612 0.001 2455810.38545 -0.605 0.001 2455810.38623 -0.613 0.001 2455810.38702 -0.619 0.001 2455810.38778 -0.593 0.001 2455810.38855 -0.607 0.001 2455810.38933 -0.603 0.001 2455810.39014 -0.611 0.001 2455810.39092 -0.611 0.001 2455810.39168 -0.606 0.001 2455810.39247 -0.618 0.001 2455810.39325 -0.623 0.001 2455810.39402 -0.617 0.001 2455810.39477 -0.608 0.001 2455810.39555 -0.605 0.001 2455810.39633 -0.613 0.001 2455810.39711 -0.598 0.001 2455810.39790 -0.597 0.001 2455810.39866 -0.605 0.001 2455810.39945 -0.609 0.001 2455810.40023 -0.608 0.001 2455810.40100 -0.616 0.001 2455810.40178 -0.613 0.001 2455810.40255 -0.615 0.001 2455810.40333 -0.605 0.001 2455810.40410 -0.609 0.001 2455810.40489 -0.611 0.001 2455810.40567 -0.604 0.001 2455810.40645 -0.609 0.001 2455810.40726 -0.612 0.001 2455810.40806 -0.611 0.001 2455810.40884 -0.629 0.001 2455810.40962 -0.609 0.001 2455810.41042 -0.617 0.001 2455810.41120 -0.607 0.001 2455810.41200 -0.623 0.001
END OF FIXED DATA SECTION. DO NOT MAKE ANY CHANGES ABOVE THIS LINE.
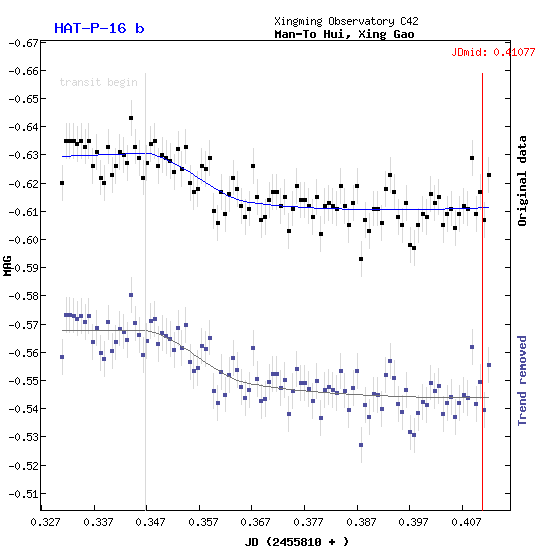
The following plots were generated in the course of ETD. The upper one plots raw data, whereas the lower one plots data with correction to systematic errors by means of both linear power and parabolic fit.

The following figure plots the residuals after the fit correction.

The plots shows the airmass versus time. As seen from the graph, the altitude of the target was setting during the observation in that the airmass kept in a tendency of incline.

Note that the interpretation of the mid transit time and the transit-egress time by the tool in ETD is problematic. According to the prediction, the mid transit time is 21:55 UT on Sep 5 2011, whereas the calculated value is 21:51:30 UT. The depth is calculated to be 0.0239 +/- 0.0044 mag.
The radius of HAT-P-16 b, denoted as Rp, is measured to be Rp = 1.782 -0.171+0.155 RJup, where RJup denotes the radius of Jupiter, whilst the currently acknowledged one is Rp = 1.289 +/- 0.066 RJup. The inclination is measured to be i = 86.02 -0.23|1.14+0.27|1.51 deg. In comparison, catalog data gives it as i = 86.6 +/- 0.7 deg.
The more iterating observations, the less negative influence from occasional errors. Therefore we Xingming Observatory C42 will continue monitor the exoplanet transits.
Copyright © Man-To Hui 2011/09/09
Feel free to e-mail me with any doubts or questions.