Introduction
Kepler-17 b is positioned at (J2000) R.A. = 19h53m34s.86, De. = + 47°48'54".0, in Cygnus, the host of which has 14.141 Vmag. According to the Exoplanet Transit Database (ETD), the transit leads to a decrease in brightness of its star seen from the earth is 0.0213 mag, and the duration is about 136.6-min.
The equipment used for the monitor was 14" SCT f/6.9 + QHY9 CCD.
Overall 280 images with individual exposure 43s were remotely taken by Xing Gao, from Urumqi, China at predawn on Aug 23 local time, which were later callibrated with bias, dark, and flat frames in MaxIm DL. Subsequently I sort these individual images into quadruplets, which were stacked in Astrometrica by means of median. As MPO Canopus refused to measure some of the series, I had to use MaxIm DL to measure the lightcurve.
Here comes the data:
  J. D. HEL.  KEPLER-17B    +/-
------------- ----------  -------
2455796.23687    13.793    0.002
2455796.23932    13.781    0.002
2455796.24174    13.779    0.002
2455796.24417    13.796    0.002
2455796.24661    13.795    0.002
2455796.24905    13.793    0.002
2455796.25148    13.792    0.002
2455796.25391    13.797    0.002
2455796.25635    13.795    0.002
2455796.25878    13.808    0.002
2455796.26123    13.799    0.002
2455796.26367    13.792    0.002
2455796.26612    13.799    0.002
2455796.26856    13.816    0.002
2455796.27101    13.815    0.002
2455796.27347    13.819    0.002
2455796.27591    13.828    0.002
2455796.27835    13.823    0.002
2455796.28080    13.818    0.002
2455796.28325    13.809    0.002
2455796.28569    13.816    0.002
2455796.28814    13.818    0.002
2455796.29058    13.831    0.002
2455796.29307    13.830    0.002
2455796.29552    13.831    0.002
2455796.29797    13.831    0.002
2455796.30042    13.840    0.002
2455796.30289    13.837    0.002
2455796.30533    13.848    0.002
2455796.30778    13.847    0.002
2455796.31024    13.840    0.002
2455796.31269    13.843    0.002
2455796.31514    13.858    0.002
2455796.31760    13.847    0.002
2455796.32004    13.847    0.002
2455796.32250    13.849    0.002
2455796.32496    13.847    0.002
2455796.32741    13.851    0.002
2455796.32987    13.845    0.002
2455796.33231    13.851    0.002
2455796.33476    13.854    0.002
2455796.33722    13.840    0.002
2455796.33968    13.840    0.002
2455796.34213    13.836    0.002
2455796.34459    13.820    0.002
2455796.34704    13.832    0.002
2455796.34950    13.828    0.002
2455796.35195    13.822    0.002
2455796.35441    13.827    0.002
2455796.35687    13.829    0.002
2455796.35932    13.829    0.002
2455796.36177    13.811    0.002
2455796.36423    13.806    0.002
2455796.36669    13.824    0.002
2455796.36914    13.816    0.002
2455796.37160    13.828    0.007
2455796.37406    13.834    0.002
2455796.37652    13.810    0.002
2455796.37898    13.822    0.002
2455796.38144    13.805    0.002
2455796.38391    13.811    0.002
2455796.38636    13.825    0.002
2455796.38883    13.800    0.002
2455796.39129    13.802    0.002
2455796.39377    13.830    0.002
2455796.39623    13.819    0.002
2455796.39871    13.813    0.002
2455796.40118    13.815    0.002
2455796.40364    13.815    0.002
2455796.40610    13.818    0.002
The following plots were generated in the course of ETD. The upper one plots raw data, whereas the lower one plots data with correction to systematic errors by means of both linear power and parabolic fit.
The following figure plots the residuals after the fit correction.
![]()
The plots shows the airmass versus time. As seen from the graph, the altitude of the target was setting lower during the observation in that the airmass kept in a tendency of incline.
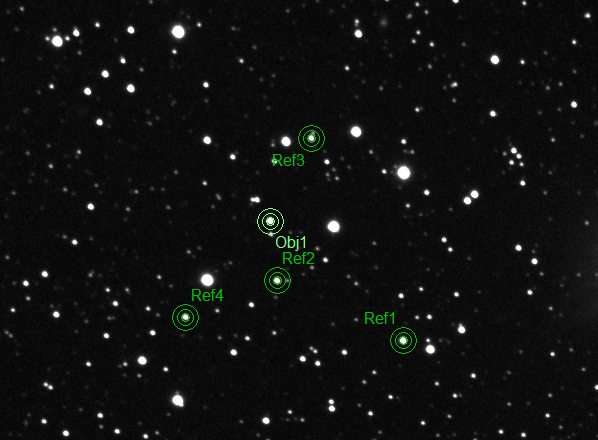
Overall 4 reference stars were taken adjacent to the target, as shown in the following image. Magnitude sources were taken from USNO-A 2.0 star catalog in R band, rendered in Canopus.
The lightcurve looks gruesome. Initially I thought it was due to interference from clouds. However, when tracing back within the individual images one by one, I found nothing whatsoever. I also redid the measurement with non-stacked post-callibration images and stacked-in-quintuplet images in another sofware FotoDif, yet the tendency of the lightcurve showed little change. Later I thought up of the most serious condition when the monitor was on -- moonlight. I suspect whether there were some clouds passing through the moon resulting in brightness variation in the sky background. Thus far it is the most plausible explanation.
ETD measures the mid-transit time, duration and depth for me, respectively JD 2455796.30538 ± 0.0018, 124.0 ± 6.5 min, 0.0231 ± 0.0039 mag. The radius of the exoplanet is also estimated: Rp = 1.443 -0.126+0.116 RJup, where RJup denotes the radius of Jupiter, whereas the currently acknowledged value is Rp = 1.312 ± 0.018 RJup.
More observations are needed to remove occasional errors before the calculation in good accuracy.
Copyright © Man-To Hui 2011/09/09
Feel free to e-mail me with any doubts or questions.