Introduction
Qatar-1 b is positioned approximately at (J2000) R.A. = 20h13m32s, De. = + 65°09'43", in Draco, the host of which has 12.84 Vmag. According to the Exoplanet Transit Database (ETD), the transit leads to a decrease in brightness of its star seen from the earth is 0.0204 mag, and the duration is about 96.7-min.
The equipment used for the monitor was 14" SCT f/6.9 + QHY9 CCD.
Overall 500 images with individual exposure 15-s were remotely taken by Xing Gao, from Urumqi, China at predawn on Sep 28 local time, which were later callibrated with bias, dark, and flat frames in MaxIm DL by me. Subsequently I sorted these individual images into quintuplets, which were stacked in Astrometrica by means of median. I employed both MPO Canopus and MaxIm DL to measure the lightcurve, and found that the latter prevailed the former a bit and therefore only the results measured by MaxIm DL were performed.
Here comes the data:
-------------------------------------------
      J.D.            Qatar-1 b    Err
-------------------------------------------
2455832.17932291 	13.213    0.001
2455832.18093171 	13.214    0.001
2455832.18252893 	13.213    0.001
2455832.18390625 	13.221    0.001
2455832.18528356 	13.214    0.001
2455832.18666087 	13.217    0.001
2455832.18806134 	13.213    0.001
2455832.18945023 	13.204    0.001
2455832.19082754 	13.211    0.001
2455832.19220486 	13.216    0.001
2455832.19358217 	13.214    0.001
2455832.19497106 	13.211    0.001
2455832.19634837 	13.223    0.001
2455832.19772569 	13.215    0.001
2455832.19911458 	13.231    0.001
2455832.20050347 	13.220    0.001
2455832.20188078 	13.221    0.001
2455832.20326967 	13.227    0.001
2455832.20464699 	13.227    0.001
2455832.20602430 	13.225    0.001
2455832.20741319 	13.233    0.001
2455832.20880208 	13.233    0.001
2455832.21020254 	13.242    0.001
2455832.21160300 	13.250    0.001
2455832.21299189 	13.243    0.001
2455832.21438078 	13.252    0.001
2455832.21578125 	13.250    0.001
2455832.21715856 	13.257    0.001
2455832.21855902 	13.262    0.001
2455832.21994791 	13.254    0.001
2455832.22133680 	13.256    0.001
2455832.22272569 	13.252    0.001
2455832.22412615 	13.260    0.001
2455832.22552662 	13.258    0.001
2455832.22692708 	13.263    0.001
2455832.22832754 	13.263    0.001
2455832.22973958 	13.260    0.001
2455832.23114004 	13.255    0.001
2455832.23254050 	13.254    0.001
2455832.23395254 	13.264    0.001
2455832.23536458 	13.259    0.001
2455832.23676504 	13.270    0.001
2455832.23817708 	13.270    0.001
2455832.23958912 	13.267    0.001
2455832.24098958 	13.254    0.001
2455832.24239004 	13.277    0.001
2455832.24379050 	13.267    0.001
2455832.24519097 	13.260    0.001
2455832.24659143 	13.272    0.001
2455832.24799189 	13.269    0.001
2455832.24939236 	13.263    0.001
2455832.25079282 	13.272    0.001
2455832.25220486 	13.262    0.001
2455832.25361689 	13.259    0.001
2455832.25501736 	13.270    0.001
2455832.25642939 	13.267    0.001
2455832.25782986 	13.263    0.001
2455832.25925347 	13.261    0.001
2455832.26066550 	13.261    0.001
2455832.26208912 	13.249    0.001
2455832.26350115 	13.255    0.001
2455832.26491319 	13.245    0.001
2455832.26631365 	13.258    0.001
2455832.26772569 	13.249    0.001
2455832.26913773 	13.247    0.001
2455832.27054976 	13.258    0.001
2455832.27196180 	13.249    0.001
2455832.27338541 	13.249    0.001
2455832.27479745 	13.246    0.001
2455832.27622106 	13.254    0.001
2455832.27764467 	13.247    0.001
2455832.27905671 	13.253    0.001
2455832.28046875 	13.248    0.001
2455832.28188078 	13.252    0.001
2455832.28330439 	13.249    0.001
2455832.28473958 	13.247    0.001
2455832.28615162 	13.253    0.001
2455832.28757523 	13.239    0.001
2455832.28899884 	13.252    0.001
2455832.29041088 	13.258    0.001
2455832.29183449 	13.242    0.001
2455832.29324652 	13.253    0.001
2455832.29467013 	13.255    0.001
2455832.29608217 	13.254    0.001
2455832.29750578 	13.250    0.001
2455832.29894097 	13.249    0.001
2455832.30035300 	13.250    0.001
2455832.30178819 	13.265    0.001
2455832.30322337 	13.256    0.001
2455832.30462384 	13.240    0.001
2455832.30605902 	13.255    0.001
2455832.30748263 	13.266    0.001
2455832.30890625 	13.248    0.001
2455832.31032986 	13.265    0.001
2455832.31175347 	13.246    0.001
2455832.31317708 	13.244    0.001
2455832.31460069 	13.254    0.001
2455832.31603587 	13.261    0.001
2455832.31745949 	13.261    0.001
2455832.31889467 	13.251    0.001
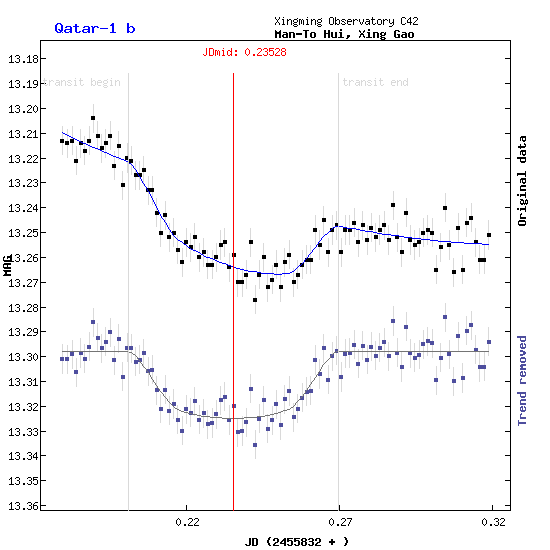
The following plots were generated in the course of ETD. The upper one plots raw data, whereas the lower one plots data with correction to systematic errors by means of both linear power and parabolic fit.

The following figure plots the residuals after the fit correction.

The plots shows the airmass versus time. As seen from the graph, the altitude of the target was setting lower during the observation in that the airmass kept in a tendency of incline.

Overall 5 reference stars were taken adjacent to the target, as shown in the following image. Magnitude sources were taken from USNO-A 2.0 star catalog in V band, rendered in Canopus.

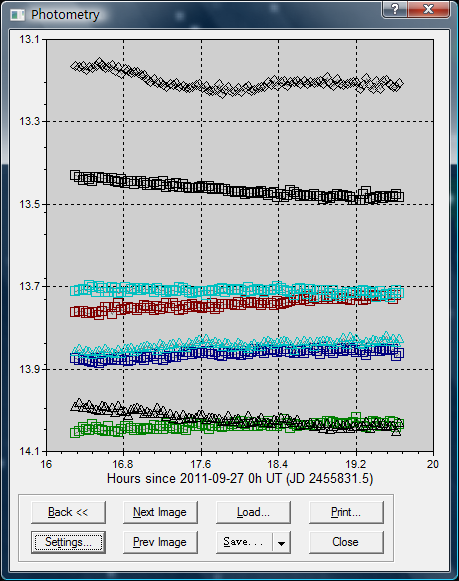
The following graph plots the lightcurves of all of the comparison stars, symbolized in squares, along with the two checked stars, shaped in triangles. The lightcurve atop the graph is the one of the transiting star. I suspect if some of the comparison stars actually are variable stars since their tendencies deviate from each other. It may well be imperfection due to poor quality of the flatfield images containing stars from different portions of the sky as well, which were taken at dawn when the sky was brightening rapidly.

ETD measures the mid-transit time, duration and depth for me, respectively JD 2455832.23528 ± 0.00085, 98.9 ± 3.6 min, 0.0271 ± 0.0021 mag. The radius of the exoplanet is also estimated: Rp = 1.261 -0.049+0.047 RJup, where RJup denotes the radius of Jupiter, whereas the currently acknowledged value is Rp = 1.164 ± 0.045 RJup. Besides, the inclination was measured to be i = 83.47 -0.49|1.11+0.55|1.30 deg, compared to the currently recognized value i = 83.47 ± 0.38 deg, relatively close.
More observations are needed to remove occasional errors before the calculation in good accuracy.
Copyright © Man-To Hui 2011/10/02
Feel free to e-mail me with any doubts or questions.