|
|
Sequence 2x resized;
Courtesy of STEREO/SECCHI |
Introduction
P/1999 R1 = P/2003 R5 = P/2007 R5 is the first Kracht group comet that has ever been observed by STEREO/SECCHI. The comet was reported by Bo Zhou (Shaanxi, China) in realtime C3 images from Sep 06 2011. It is the fourth apparition of the comet.
|
|
|
Sequence 2x resized;
Courtesy of STEREO/SECCHI |
Calibration Work
So long as astrometric measurements will not baffle me, I mainly intended to conduct the photometry of the comet as accurate as possible. Once the results are obtained, and merged with data from SOHO images, it is possible to analyze its lightcurve and even its phase function, whereby one may smatter some knowledge about whether the comet is gaseous or dusty.
I was supposed to employ IDL to conduct such work, however, I have not yet installed the SolarSoft IDL library, and therefore I had to use back my preferred Fitswork to calibrate the sequence. Having downloading the HI1A images from Sep 06 2011, I found that, unfortunately, not only did the F-corona act as the contaminant, but the summer Milky Way along with its core also had a significant influence upon the calculation of a qualified background. The more images are used for the calculation, the better quality the background will be of. Yet unluckily the streams of the corona form a function of time. Too many images will be inappropriate as well. So as to achieve the best results, after the series of individual images were corrected by a flatfield, a median background was calculated from overall 72 images spanning two days, with which later was subtracted from the individual raw images that contained the sungrazer.
Time permitting soon, I will apply the method used by Mr. Matthew Knight to do photometry of comets in SOHO images, that the individual images are first corrected by a flatfield and later these corrected images of interest will be subtracted by their respective median background images which each is calculated from two images closely prior to the to-be-calibrated image and two subsequent images. Since it will be very cumbersome to carry on such work in ordinary public software, I may employ IDL to help my work for flexibility and convenience. Thank goodness, there are already countless IDL routines available throughout the Internet.
Results
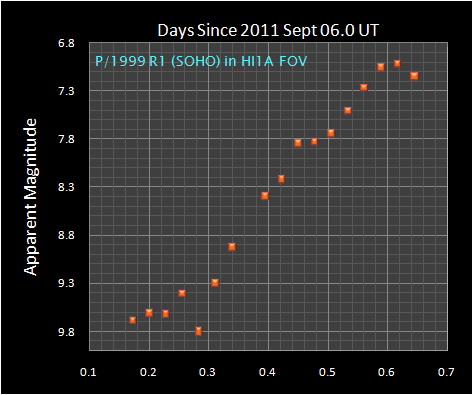
I implemented Astrometrica to measure the positions and the photometry of the comet in HI1A images from Sep 06 2011. The aperture used was not unchanged during the measurement, which frankly sounds so preposterous in terms of photometry. Alas I had no idea to tackle the contradiction without adjusting the aperture. At the beginning an aperture of 3-pixel was too large for the comet, however, an aperture of 2-pixel was not large enough to encompass the head of the comet before the comet left the FOV. Hence I switched the radius of the aperture from 2-pixel to 3-pixel after having completed measuring images at 08:49:01 UT. Objectively it did not change the trend largely. Here are my measurements with space vectors at corresponding time added:
COD C49
CON M.-T. Hui, Dept. of Physics, Wuhan University, China
MEA M.-T. Hui
NET UCAC-3
PJ99R010 4S2011 09 06.12432 18 01 40.13 -23 51 55.1 9.70N C49
PJ99R010 4s2011 09 06.12432 2 -0.89422312 +1.15439741 +0.49866987 C49
PJ99R010 4S2011 09 06.15209 18 01 42.49 -23 51 45.4 9.62N C49
PJ99R010 4s2011 09 06.15209 2 -0.89483824 +1.15401378 +0.49850286 C49
PJ99R010 4S2011 09 06.17987 18 01 45.60 -23 50 43.3 9.63N C49
PJ99R010 4s2011 09 06.17987 2 -0.89545317 +1.15362987 +0.49833572 C49
PJ99R010 4S2011 09 06.20765 18 01 44.95 -23 49 27.7 9.42N C49
PJ99R010 4s2011 09 06.20765 2 -0.89606791 +1.15324567 +0.49816847 C49
PJ99R010 4S2011 09 06.23543 18 01 48.26 -23 47 19.6 9.81N C49
PJ99R010 4s2011 09 06.23543 2 -0.89668244 +1.15286119 +0.49800109 C49
PJ99R010 4S2011 09 06.26321 18 01 46.58 -23 44 39.6 9.31N C49
PJ99R010 4s2011 09 06.26321 2 -0.89729678 +1.15247643 +0.49783359 C49
PJ99R010 4S2011 09 06.29099 18 01 49.57 -23 43 04.4 8.94N C49
PJ99R010 4s2011 09 06.29099 2 -0.89791092 +1.15209139 +0.49766597 C49
PJ99R010 4S2011 09 06.34654 18 01 48.78 -23 40 03.9 8.41N C49
PJ99R010 4s2011 09 06.34654 2 -0.89913860 +1.15132045 +0.49733036 C49
PJ99R010 4S2011 09 06.37432 18 01 42.99 -23 38 07.7 8.23N C49
PJ99R010 4s2011 09 06.37432 2 -0.89975214 +1.15093456 +0.49716237 C49
PJ99R010 4S2011 09 06.40209 18 01 40.13 -23 35 51.7 7.86N C49
PJ99R010 4s2011 09 06.40209 2 -0.90036549 +1.15054838 +0.49699426 C49
PJ99R010 4S2011 09 06.42987 18 01 39.23 -23 34 46.6 7.84N C49
PJ99R010 4s2011 09 06.42987 2 -0.90097864 +1.15016193 +0.49682603 C49
PJ99R010 4S2011 09 06.45765 18 01 33.06 -23 32 47.9 7.75N C49
PJ99R010 4s2011 09 06.45765 2 -0.90159158 +1.14977519 +0.49665767 C49
PJ99R010 4S2011 09 06.48543 18 01 29.59 -23 30 52.2 7.52N C49
PJ99R010 4s2011 09 06.48543 2 -0.90220433 +1.14938817 +0.49648920 C49
PJ99R010 4S2011 09 06.51321 18 01 23.02 -23 28 28.5 7.28N C49
PJ99R010 4s2011 09 06.51321 2 -0.90281688 +1.14900086 +0.49632060 C49
PJ99R010 4S2011 09 06.54098 18 01 18.20 -23 26 54.2 7.07N C49
PJ99R010 4s2011 09 06.54098 2 -0.90342924 +1.14861328 +0.49615188 C49
PJ99R010 4S2011 09 06.56876 18 01 11.85 -23 25 17.7 7.03N C49
PJ99R010 4s2011 09 06.56876 2 -0.90404139 +1.14822541 +0.49598304 C49
PJ99R010 4S2011 09 06.59654 18 01 04.62 -23 23 08.0 7.16N C49
PJ99R010 4s2011 09 06.59654 2 -0.90465334 +1.14783726 +0.49581408 C49
----- end -----
Astrometrica also rendered me a photometry file attached as follows:
EXPOSURE JD: Mid-exposure, not corrected for light time
---------------------------------------------------
JD mag SNR ZeroPt Design.
---------------------------------------------------
2455810.62432 9.70 R 2.92 19.92 PJ99R010
2455810.65209 9.62 R 2.10 19.92 PJ99R010
2455810.67987 9.63 R 1.84 19.92 PJ99R010
2455810.70765 9.42 R 3.74 19.92 PJ99R010
2455810.73543 9.81 R 2.67 19.92 PJ99R010
2455810.76321 9.31 R 5.01 19.92 PJ99R010
2455810.79099 8.94 R 7.07 19.92 PJ99R010
2455810.84654 8.41 R 15.81 19.92 PJ99R010
2455810.87432 8.23 R 11.68 19.92 PJ99R010
2455810.90209 7.86 R 9.83 19.92 PJ99R010
2455810.92987 7.84 R 11.15 19.92 PJ99R010
2455810.95765 7.75 R 22.09 19.92 PJ99R010
2455810.98543 7.52 R 17.21 19.93 PJ99R010
2455811.01321 7.28 R 26.53 19.92 PJ99R010
2455811.04098 7.07 R 14.39 19.93 PJ99R010
2455811.06876 7.03 R 18.28 19.92 PJ99R010
2455811.09654 7.16 R 21.44 19.92 PJ99R010
----- end -----The lightcurve observed by HI1A:
I received astrometric measurements in LASCO C3 images from Rainer Kracht:
PJ99R010 3S2011 09 06.84601 10 54 15.72 +07 15 08.1 5.79N 249
PJ99R010 3s2011 09 06.84601 2 -0.00766471 +0.00628103 +0.00266703 249
PJ99R010 3S2011 09 06.85435 10 54 11.62 +07 15 59.6 5.90N 249
PJ99R010 3s2011 09 06.85435 2 -0.00766527 +0.00627970 +0.00266670 249
PJ99R010 3S2011 09 06.86270 10 54 08.63 +07 17 05.1 5.94N 249
PJ99R010 3s2011 09 06.86270 2 -0.00766584 +0.00627838 +0.00266637 249
PJ99R010 3S2011 09 06.88314 10 53 57.20 +07 19 17.9 5.96N 249
PJ99R010 3s2011 09 06.88314 2 -0.00766721 +0.00627512 +0.00266556 249
PJ99R010 3S2011 09 06.88770 10 53 55.80 +07 20 01.4 5.92N 249
PJ99R010 3s2011 09 06.88770 2 -0.00766752 +0.00627440 +0.00266538 249
PJ99R010 3S2011 09 06.89601 10 53 51.64 +07 21 03.2 5.92N 249
PJ99R010 3s2011 09 06.89601 2 -0.00766808 +0.00627307 +0.00266505 249
PJ99R010 3S2011 09 06.90435 10 53 48.06 +07 21 53.3 6.00N 249
PJ99R010 3s2011 09 06.90435 2 -0.00766864 +0.00627175 +0.00266472 249
PJ99R010 3S2011 09 06.91267 10 53 44.05 +07 22 43.9 6.16N 249
PJ99R010 3s2011 09 06.91267 2 -0.00766920 +0.00627042 +0.00266439 249
PJ99R010 3S2011 09 06.92103 10 53 41.09 +07 23 55.1 6.13N 249
PJ99R010 3s2011 09 06.92103 2 -0.00766977 +0.00626909 +0.00266406 249
PJ99R010 3S2011 09 06.92935 10 53 36.36 +07 24 38.3 6.42N 249
PJ99R010 3s2011 09 06.92935 2 -0.00767033 +0.00626776 +0.00266373 249
PJ99R010 3S2011 09 06.93767 10 53 33.14 +07 25 49.6 6.17N 249
PJ99R010 3s2011 09 06.93767 2 -0.00767089 +0.00626644 +0.00266340 249By merging my measurements in HI1A with Rainer's in C3, I was capable of calculating an orbital solution soly for this apparition:
Orbital elements:
P/1999 R1
   Perihelion 2011 Sep 7.130443 TT =  3:07:50 (JD 2455811.630443)
Epoch 2011 Sep  7.0 TT = JDT 2455811.5   Earth MOID: 0.0947   Ve: 0.0913
M 359.96851              (2000.0)        Me: 0.0436
n   0.24140166     Peri.   48.78933      0.65945911     -0.75174040
a   2.55451944     Node   359.95082      0.60688740      0.53253611
e   0.9790503      Incl.   12.71729      0.44362298      0.38896227
P   4.08           M(N) 19.3    K  10.0   q 0.05351639  Q 5.05552249
From 28 observations 2011 Sept. 6 (19.5 hr);   RMS error 30.028 arcseconds

Residuals in arcseconds:
110906 C49 23.5- 85.8+    110906 C49 21.8+ 18.2-    110906 249  8.7- 10.9-
110906 C49 17.2-  2.3-    110906 C49 12.6-  8.5-    110906 249  2.2+  .45+
110906 C49  4.7+ 39.0-    110906 C49  .50-  2.8-    110906 249  2.6-  4.1+
110906 C49 19.4- 63.3-    110906 C49 21.4- 30.0+    110906 249  .62+  3.6-
110906 C49 16.9+ 36.1-    110906 C49  8.1- 12.6+    110906 249  3.6- 10.2-
110906 C49  9.2- 22.0+    110906 C49  5.2-  3.4-    110906 249  7.2+  4.2+
110906 C49 35.5+ 14.2+    110906 C49  3.4- 13.0+    110906 249  9.5-  8.6-
110906 C49 52.7+ 14.3-    110906 249  .42-  6.7+    110906 249  4.7-  7.3+
110906 C49  1.5-  4.2-    110906 249  .02-  2.7-
110906 C49  7.6- 24.8+    110906 249 16.2+  2.3+
Click here to see the orbit of P/1999 R1 (SOHO) in perspective of three-dimension in the solar system. (Java required)
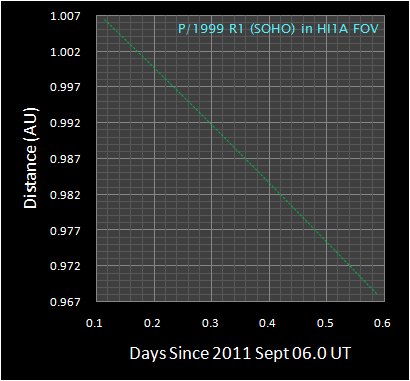
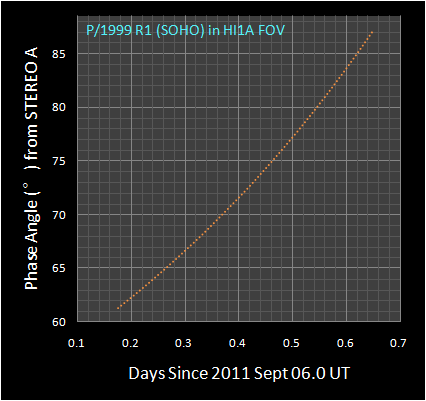
The above graph shows the distance between the comet and STEREO A as a function of time. As seen, the function of the distance between the comet and the spacecraft was almost linear during the short spell. The following one illustrates the phase angle of the comet observed from STEREO A as a function of time. During the monitor the phase angle was increasing gradually.
Here I would love to spend some time discussing effects from the phase angle. In order to understand the heliocentric dependence, it will be of necessity to correct the apparent magnitude for the variations from the phase angle. By collecting observations of numbers of comets over a wide span of phase angles, Kolokolova et al. 2004 generated a plot for the phase dependence of cometary albedo due to scattering off dust in the coma, through which one can learn that a strong forward scattering surges at phase angles greater than 100°, and that before the surge the curve remains relatively flat with a mild surge towards at phase angles close to 0° due to the backscattering effect.
Marcus managed to derive a compound Henyey–Greenstein (HG) model of the phase function which combines separate HG functions for forward scattering and backscattering, which is also dependent upon the dust-to-gas light ratio within the coma. The compound HG model is given by the following equation:
$\phi(\theta)=\frac{\delta_{90}}{1+\delta_{90}}[k(\frac{1+g_f^2}{1+g_f^2-2g_f\cos(180-\theta)})^{\frac{3}{2}}+(1-k)(\frac{1+g_b^2}{1+g_b^2-2g_b\cos(180-\theta)})^{\frac{3}{2}}+\frac{1}{\delta_{90}}] $,
where $\theta$ is the phase angle, $\phi(\theta)$ is the scattering function, which can be easily converted into the form in terms of magnitudes by the relationship $\Phi(\theta)=-2.5\log{[\phi(\theta)]}$, $\delta_{90}$ is the dust-to-gas light ratio of the coma at phase angle $\theta=90°$, $g_f$ and $g_b$ are respectively the asymmetry factors for forward scattering and the backscattering with confinements $0\leqslantg_f\leqslant1$ and $-1\leqslantg_f\leqslant0$, and $k$ is called the partitioning coefficient between foward scattering and backscattering with the property $0\leqslantk\leqslant1$. On top of the parameter $\delta_{90}$, the other parameters remain constants for varies of comets as proven by Marcus with samples from six comets. He obtained $g_f=0.9$, $g_b=-0.6$, and $k=0.95$. As for $\delta_{90}$ there will be great differences dependent upon comets. Marcus made $\delta_{90}=1$ for usual comets, and $\delta_{90}=10$ for the dusty. In addition, Knight et al. 2010 pointed out that ratio of the flux due to the solar continuum to the flux due to the sodium emission (gas) is $\delta_{90}=0.52$ for the C3 clear filter and $\delta_{90}=0.16$ for the C2 orange and C3 orange filters.
By writing and running scripts in Python, I managed to plot the following graph which illustrates the phase functions by Marcus with five different values of $\delta_{90}$. The smaller the value of magnitude correction is, the brighter is the comet apparently. The $y$-axis is reversed to achieve our common sense about magnitude. One needs to make a correction given by this plot at a certain phase angle with accordance to a specified $\delta_{90}$ to reveal the authentic magnitude as a correction of the phase angle. Therefore, evidently, for usual comets, their magnitudes will surge compared to the predicted curve at large phase angles regardless of forward scattering.
Judging from the figure, one will comfortably draw a conclusion that the less the value of $\delta_{90}$ is, the less the surges will be. Dusty comets suffer manifest forward scattering at large phase angles, whereas gaseous ones do not.
Unfortunately the specified value of $ \delta_{90}$ is not yet known, but given the phase angle, we can learn from the graph that the comet could have been more luminous had there been no influence from the phase effect. Nevertheless, this is only a small amount of effect that will not change things radically.
[unfinished]
Copyright © Man-To Hui on 2011/09/12